
[置顶] 泰晓 RISC-V 实验箱,配套 30+ 讲嵌入式 Linux 系统开发公开课
Ftrace 实现原理与开发实践
Wu Zhangjin 创作于 2016/10/27
By Falcon of TinyLab.org 2016-10-27 16:18:33
本文是笔者在今年中国 Linux 内核开发者大会上的演讲稿,全文发表如下。由于原文就是用 Markdown 撰写的,所以只是稍作格式调整。
- CLK 官网:http://ckernel.org
- CLK 2016:https://github.com/leonsvic/CLK
- 本文源码:https://github.com/tinyclub/markdown-lab/tree/clk-2016-ftrace/slides
Ftrace 实现原理与开发实践 吴章金, MIPS Ftrace Author, http://kernel.meizu.com 2016.10.21
什么是 Ftrace
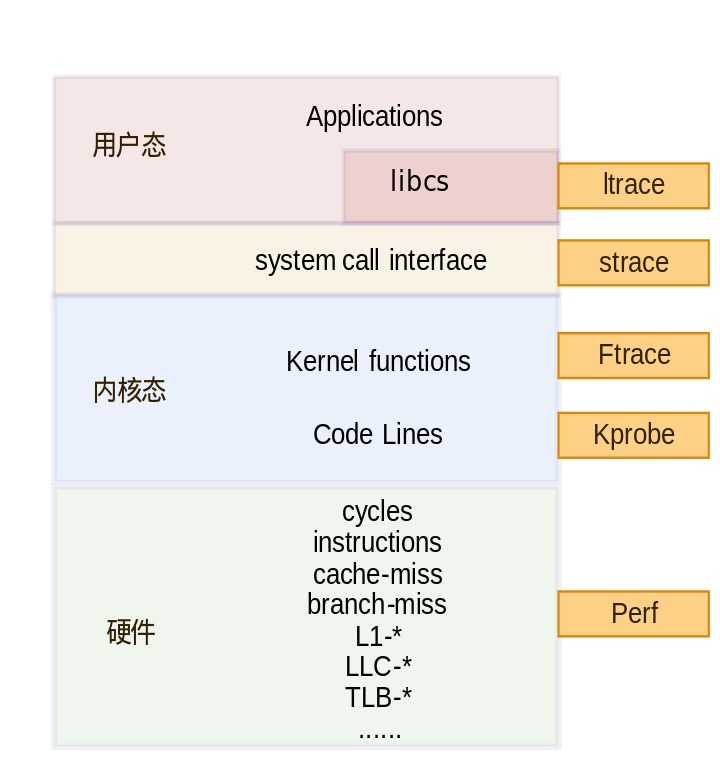
Linux tracing overview
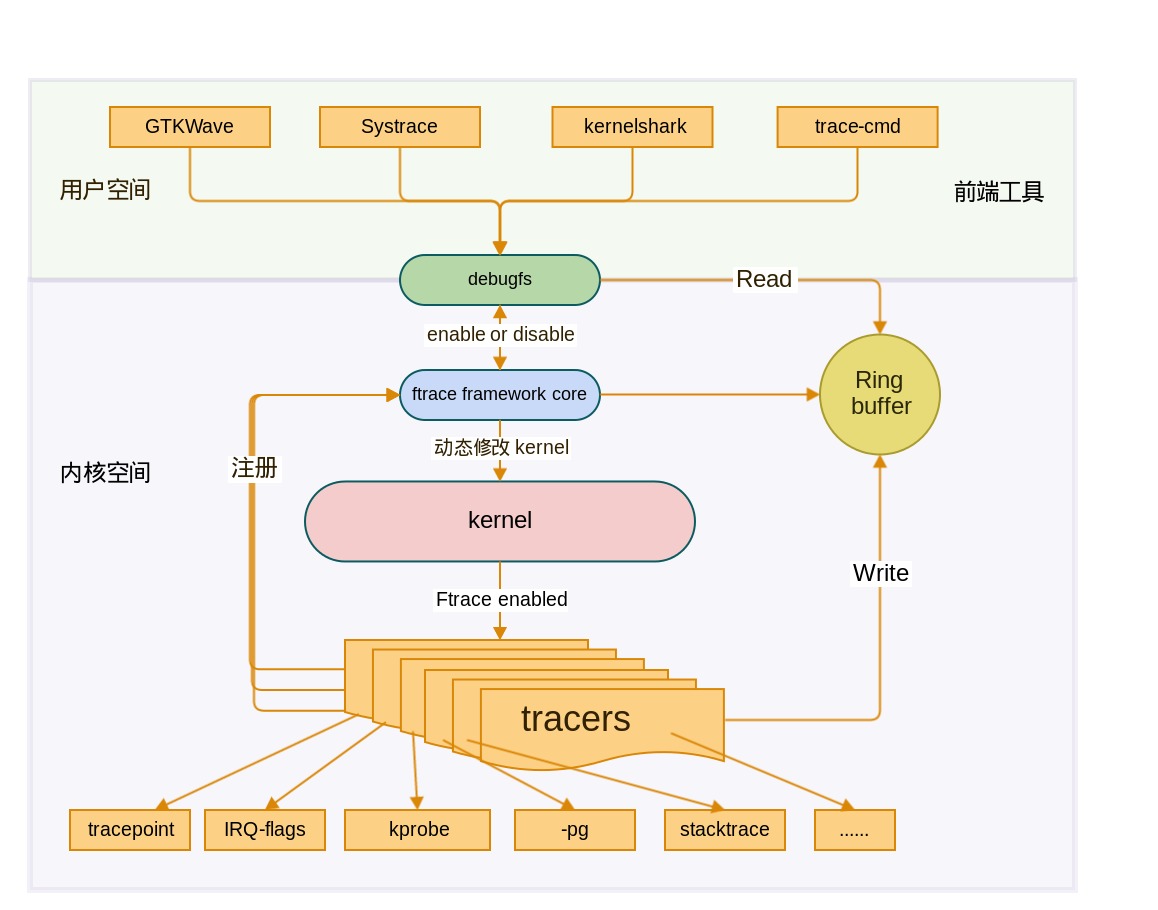
Ftrace overview
Ftrace 实现原理
Ftrace function tracer footstone: -pg
以 MIPS 为例:arch/mips/kernel/mcount.S
Ftrace:
gcc -pg$ echo 'main(){}' | \ mipsel-linux-gnu-gcc -x c -S -o - - -pg | grep mcount subu $sp,$sp,8 # _mcount pops 2 words from stack jal _mcountKFT:
gcc -finstrument-functions$ echo 'main(){}' | \ mipsel-linux-gnu-gcc -x c -S -o - - \ -finstrument-functions | egrep "enter\)|exit\)" lw $25,%call16(__cyg_profile_func_enter)($28) lw $25,%call16(__cyg_profile_func_exit)($28)
Dynamic function tracing
以 MIPS 为例:arch/mips/kernel/ftrace.c
- 编译阶段
scripts/recordmcount.{pl,c}扫描所有.text中的mcount调用点并创建__mcount_loc段
- 引导阶段
- 调用
ftrace_process_locs把所有mcount调用点替换为 nop 指令:ftrace_make_nop()
- 调用
- 跟踪阶段
- 调用
ftrace_run_update_code,替换回mcount调用点:ftrace_make_call()
- 调用
Function Graph tracer
模拟实现
__cyg_profile_func_exit在
_mcount中记录、劫持并恢复函数返回地址prepare_ftrace_return- 记录,劫持并模拟enter:
ftrace_push_return_trace
- 记录,劫持并模拟enter:
return_to_handler- 用于劫持原有的返回地址
- 然后调用
ftrace_return_to_handler,并模拟exit:ftrace_pop_return_trace - 恢复原来的返回地址并跳回
High resolution trace clock: sched_clock()
- 高精度:
us/nskernel/sched_clock.c定义的sched_clock()基于jiffies,精度不够
- 快速高效
- 无锁,直接读硬件计数器,X86:
rdtsc/rdtscll,MIPS:read_c0_count() Cycles转ns算法优化:arch/x86/include/asm/timer.h
- 无锁,直接读硬件计数器,X86:
- 不能溢出
32 位转 64 位
include/linux/cnt32_to_63.h: cnt32_to_63()
- 稳定性
- 计数频率要求稳定,如果 clock 跟处理器频率关联,需要关闭 cpufreq
- notrace:
__attribute__((no_instrument_function))不能跟踪,否则会死循环
_mcount() -> sched_clock() -> _mcount()
User space tracing
- 可通过
trace_marker模拟实现用户态函数跟踪 - Systrace 实现
Java
Trace.traceBegin(tag, name)/Trace.traceEnd(tag)Native
ATRACE_BEGIN(name)/ATRACE_END()
- 实现原理
atrace_init_once()
atrace_marker_fd = open("/sys/kernel/debug/tracing/trace_marker", O_WRONLY);ATRACE_BEGIN(name)snprintf(buf, ATRACE_MESSAGE_LENGTH, "B|%d|%s", getpid(), name); write(atrace_marker_fd, buf, len);ATRACE_END()char c = 'E'; write(atrace_marker_fd, &c, 1);
More
KFT: Normal buffer
Ftrace: Ring buffer
- trace_pipe
Ftrace 开发实践
Filesystem tracing for broken symlink
- 问题:F2FS 某个符号链接偶尔创建异常导致系统启动失败
- 符号链接文件存在,但是指向为空
- 排查:排查是所有链接异常还是单一情况
- 通过
trace_printk跟踪 - 经
/sys/kernel/debug/tracing/trace查看结果 fs/f2fs/namei.c:
err = f2fs_add_link(dentry, inode);
if (err)
    goto out;
trace_printk("dir ino %ld, target name %s, sym name %s.\n", dir->i_ino, dentry->d_name.name, symname);
f2fs_unlock_op(sbi);
- 通过
- 结论:发现其他符号链接创建正常
- 根源:异常掉电导致符号链接创建不完整并且无 f2fsck 无覆盖此类情况
Latency v.s. throughput
- Latency tracing
- cyclictest:长时间跑+后台负载,测试latency
irqsoff tracer:用于跟踪引起延迟的原因
echo irqsoff > /sys/kernel/debug/tracing/current_tracer
- Max Latency:+10ms
- 主要延迟在 USB driver:
dwc3_interrupt()中 - 观察后发现是
dwc3_interrupt()没有线程化
- 主要延迟在 USB driver:
- 中断线程化
- 增加
dwc3_thread_interrupt() - 数据延迟经
cylictest验证较为稳定 - 参照 drivers/usb/dwc3/gadget.c 线程化
- 增加
- Latency 消失,但造成 Throughput 衰退
- 发现 RNDIS 下降明显
- iperf 线程化前:91/72
- iperf 线程化后:45/39
Home Idle tracing for power jitter
Home idle tracing (Cont.)
- top: process level
- perf top: function level
Ftrace workqueue event tracer: workqueue function level
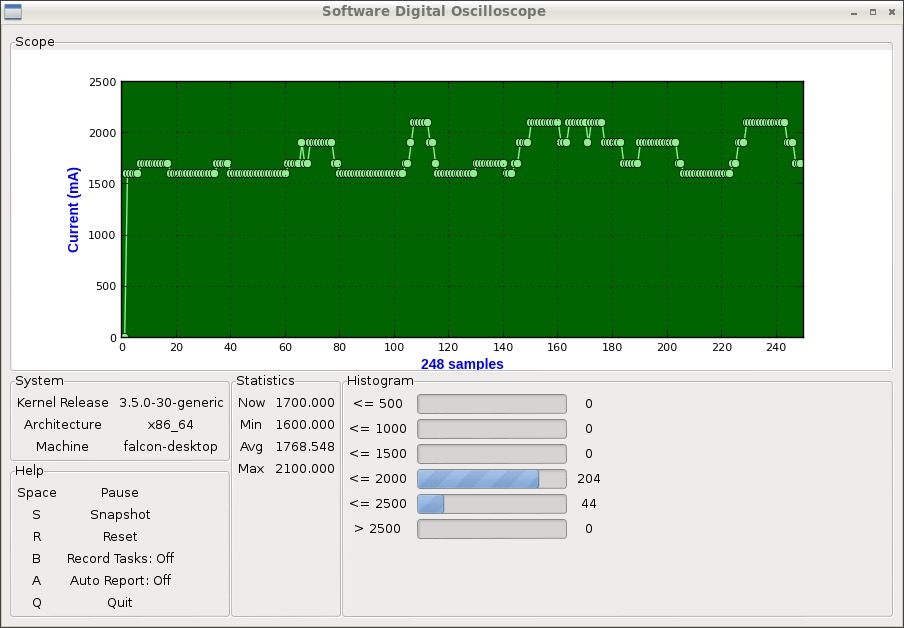
$ echo workqueue:workqueue_queue_work > /sys/kernel/debug/tracing/set_event $ cat /sys/kernel/debug/tracing/trace- 实时渲染数据流 + 快捷捕获后台执行环境
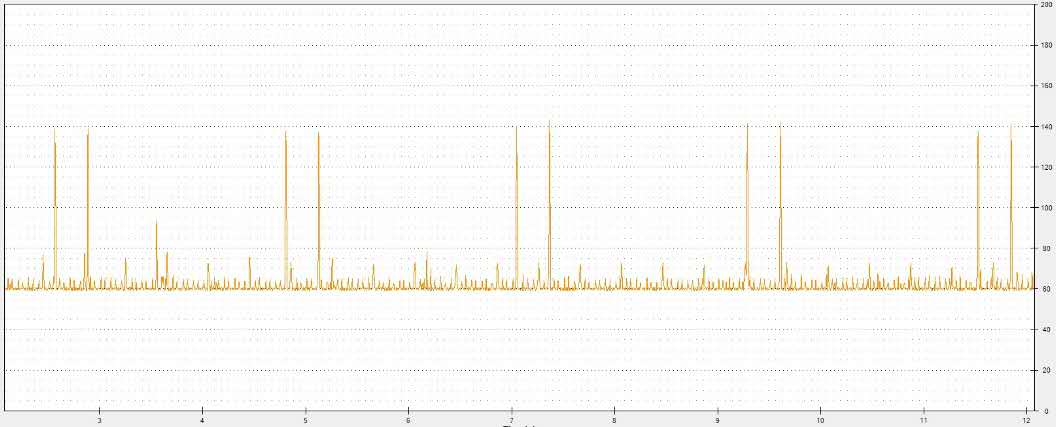
- 软件示波器:oscilloscope
- 快捷按键捕获后台数据
- 根据某个触发条件自动捕获:Max, Avg
Home idle tracing (Cont.)
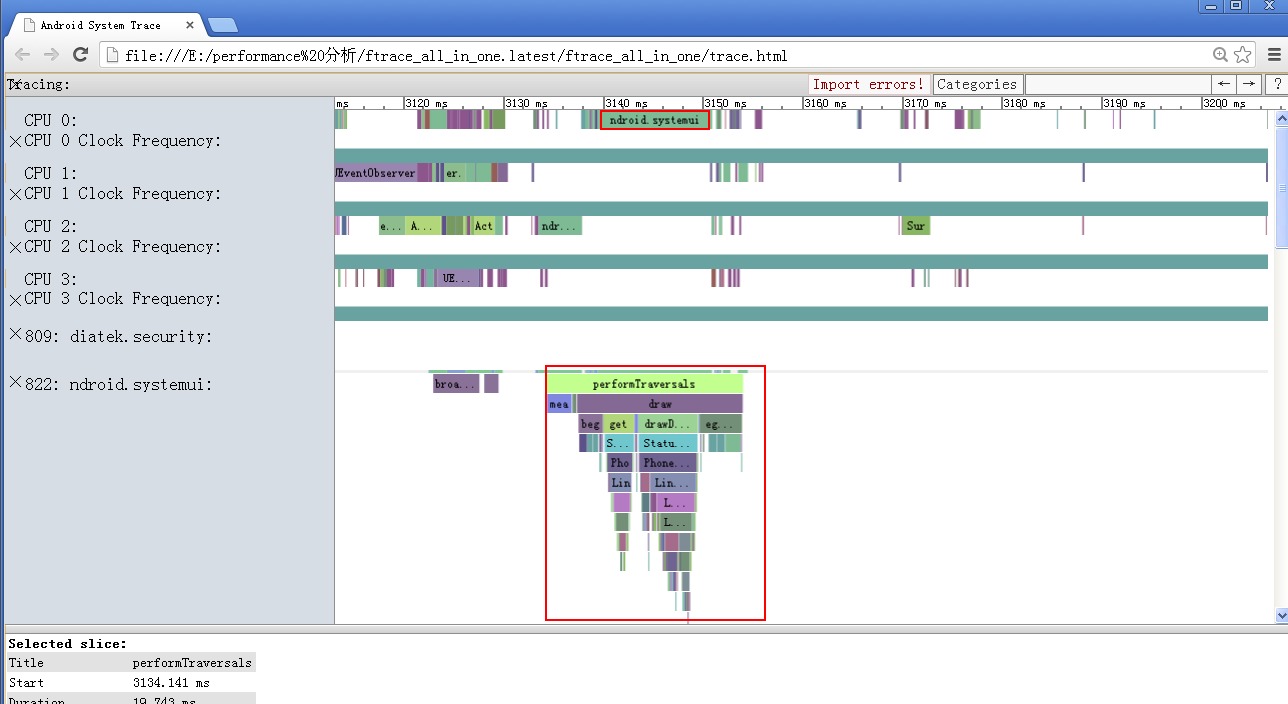
Graphic tracing for display performance tuning
从应用层加跟踪点
+ Trace.traceBegin(Trace.TRACE_TAG_VIEW, "performaTraversals");
performTraversals();
+ Trace.traceEnd(Trace.TRACE_TAG_VIEW);
通过 Systrace 启动跟踪
$ systrace.py --time=10 -o trace.html gfx sched view wm分析跟踪结果
- 通过 Chrome 浏览器解析
trace.html
- 通过 Chrome 浏览器解析
Graphic tracing (Cont.)
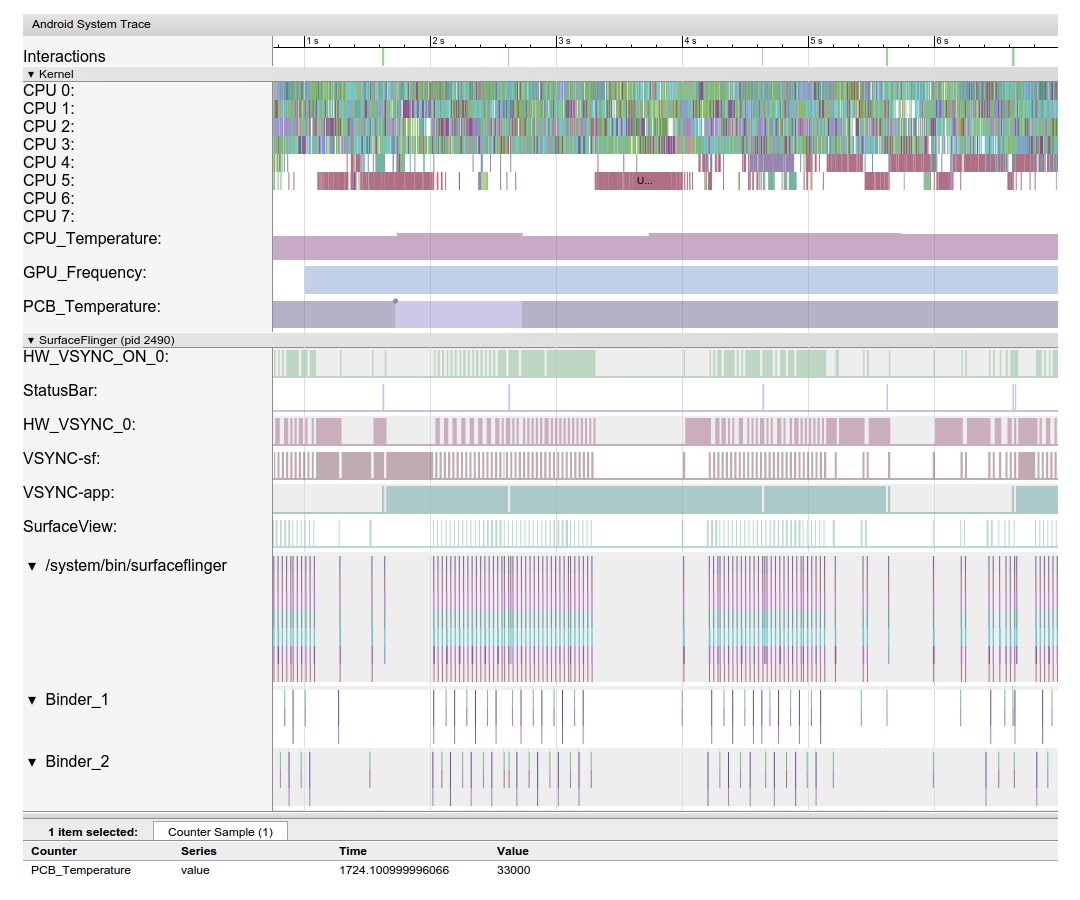
Thermal tracing for board temprature control

Thermal tracing (Cont.)
- 从内核中定义跟踪点(tracepoints)
include/trace/events/thermal.hTRACE_EVENT(thermal_temperature, ... TP_printk("thermal_zone=%s id=%d temp_prev=%d temp=%d", __get_str(thermal_zone), __entry->id, __entry->temp_prev, __entry->temp));
从内核中调用跟踪点
driver/thermal/thermal_core.c: update_temperature():

trace_thermal_temperature(tz);
Systrace 工作目标
$ systrace.py --time=10 -o trace.html temp sched gfx
Thermal tracing (Cont.)
- 在 atrace 中启用该事件
frameworks/native/cmds/atrace/atrace.cpp: k_categories{"temp","Thermal temperature",0,{ {REQ,"/sys/kernel/debug/tracing/events/thermal/thermal_temperature/enable" },}},
- 在 Systrace 中解析
- 需要增加专门的解析代码
- 或修改
script.js - 或添加独立的解析文件
thermal_parser.html并追加到ftrace_importer.html thermalTemperatureEvent: function():// js 正则表达式提取 ftrace thermal 相关数据 var event = /thermal_zone=(.+) id=(\d) temp_prev=(\d+) temp=(\d+)/.exec(eventBase.details); // 拿到 thermal zone 名字 var name = event[1]; // 拿到温度 var thermalTemperature = parseInt(event[4]); // 调用 Systrace 框架提供的显示函数画出温度曲线; this.thermalTemperatureSlice(ts, name, thermalTemperature);
- 或修改
- 并绑定上述事件到解析代码
function ThermalParser(importer)importer.registerEventHandler('thermal_temperature', ThermalParser.prototype.thermalTemperatureEvent.bind(this));
- 需要增加专门的解析代码
Thermal tracing (Cont.)
Ftrace 在线演示
Linux Lab 介绍
- 基于 Docker/Qemu 的嵌入式 Linux 开发环境
- 首页:https://tinylab.org/linux-lab
- 仓库:https://github.com/tinyclub/linux-lab
- 特性
- Docker 容器化
- 可通过 Web 访问的 LXDE Desktop(基于noVNC)
- 预安装 4 大架构的交叉编译器
- 集成 Uboot, Linux Kernel, Buildroot
- 支持大量 Qemu 虚拟的开发板(免费)
- 灵活配置、编译和引导
Linux Lab 介绍(Cont.)
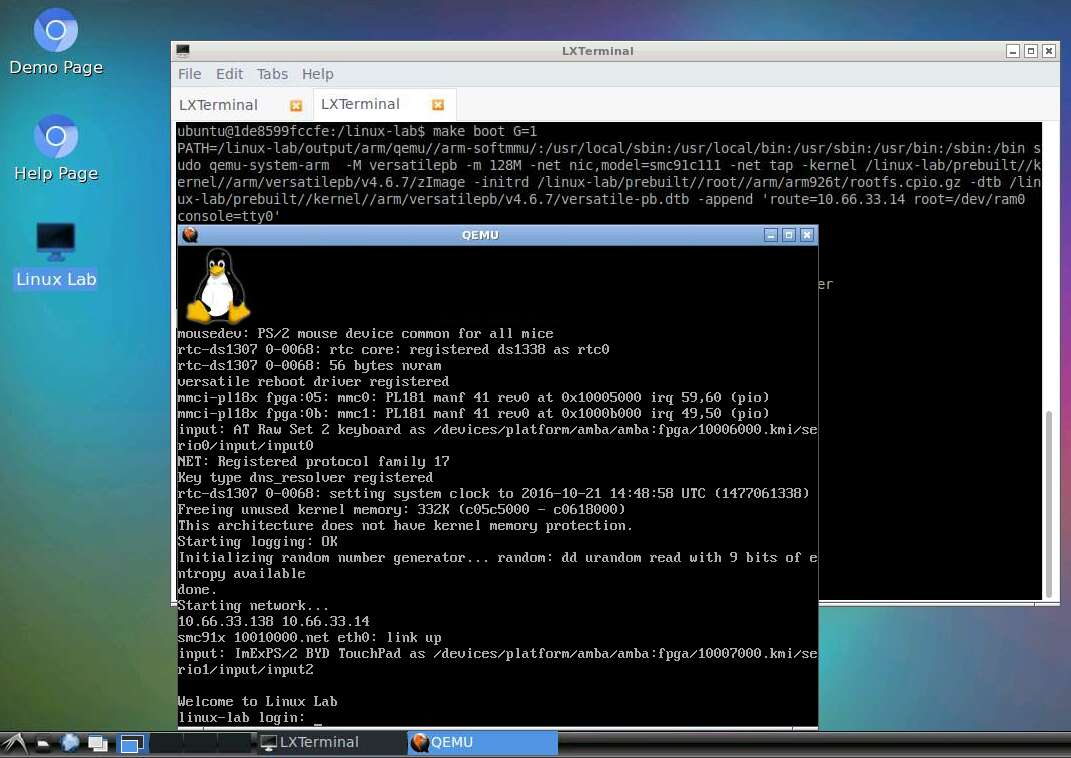
Online Ftrace Demo
Doc: doc/ftrace
Linux Lab Host
$ make list             # List supported boards
$ make BOARD=malta boot
Qemu Malta Board
# tools/trace.sh function_graph "ls -l"
# head -15 trace.log

# tracer: function_graph
#
# CPU  DURATION                  FUNCTION CALLS
# |     |   |                     |   |   |   |
 0)               |          unlock_page() {
 0)   0.541 us    |            page_waitqueue();
 0)   0.584 us    |            __wake_up_bit();
 0) + 16.333 us   |          }
Online KFT Demo
Doc: doc/kft/kft_kickstart.txt
Linux Lab Host
$ make test FEATURE=kft LINUX=v2.6.36 BOARD=malta TEST=prepareQemu Malta Board
# cat /proc/kft
status: run id 0, primed, triggered, complete

config:
  mode 0
  trigger start entry start_kernel
  trigger stop entry to_userspace
  filter mintime 500
  filter maxtime 0
  logentries 100000
Online KFT Demo (Cont.)
# cat /proc/kft_data
 Entry    Delta     PID        Function                        Caller
-------- -------- -------- ----------------                 ------------
     686      876      0.0 start_kernel                     rest_init
    4954      717      0.0 clockevents_register_notifier    start_kernel
    6589     4913      0.0 printk                           start_kernel
    6663     4780      0.0 vprintk                          printk
    7128     1606      0.0 vscnprintf                       vprintk
    7208     1433      0.0 vsnprintf                        vscnprintf
    9437      583      0.0 vprintk                          printk
   10090     1198      0.0 release_console_sem              vprintk
   11687     4712      0.0 cpu_probe                        setup_arch
   11789     2419      0.0 cpu_probe                        setup_arch
   11855     2007      0.0 decode_configs                   cpu_probe
   11889     1066      0.0 decode_configs                   cpu_probe
   14418     1851      0.0 cpu_probe                        setup_arch
相关参考资料
猜你喜欢:
- 我要投稿:发表原创技术文章,收获福利、挚友与行业影响力
- 知识星球:独家 Linux 实战经验与技巧,订阅「Linux知识星球」
- 视频频道:泰晓学院,B 站,发布各类 Linux 视频课
- 开源小店:欢迎光临泰晓科技自营店,购物支持泰晓原创
- 技术交流:Linux 用户技术交流微信群,联系微信号:tinylab
| 支付宝打赏 ¥9.68元 | 微信打赏 ¥9.68元 | |
 |  请作者喝杯咖啡吧 |  |
Read Album:
- LSM Oops 内存错误根因分析与解决
- Linux 下的 Sync 卡死问题分析报告
- 使用 mtrace 分析 “内存泄漏”
- 七张图看懂 Linux profiling 机制
- 探索从 vmlinux 中抓取 Linux 内核 config 文件